Gaiergy Corp
Schedule a consultation
Scroll to descend↓
Battery storage

Know the grid before you build the battery.

We model the feeder your battery would connect to, find what the utility will flag, and price the fix and the time it takes before you apply.

  • Blue dots: power flows the normal way, from the grid to the load
  • Magenta dots: power flows back toward the grid
  • Bigger, faster dots carry more power
Battery map Site Z on Feeder 1
Generic battery map A dark map of a generic town: Line X-Y at 34.5 kilovolts feeds Substation A. Feeder 1 runs along Road X to a battery at Site Z. Feeder 2 runs down Road Y to homes at Location Y. Moving dots show power flow. At night the battery charges from the grid. By day it discharges and, at light load, power flows back through the substation.
Line X-Y, 34.5 kV
Substation A
Road X
Road Y
Road W
Feeder 1
Feeder 2
Site Z, battery
Location Y homes
Reverse power
ModeNight: charging
Battery2,500 kW in
Feeder 1 head2,947 kW out to the feeder
Bank TB 13,121 kW forward
Generic map. Flows are from one Gaiergy Grid Studio run of a 2.50 MW battery at a generic 4.8 kV site at light load (illustration, not a real site).
How we analyze the grid

Five steps on public data, before you pay a study fee.

We study the one feeder that would serve the battery, at the hours that stress it most.

Step 01

Gather the public grid data

Utility hosting capacity maps, feeder and bank ratings, load forecasts and the generators already on the line, for the feeder that serves the site.

Step 02

Build the feeder model

We rebuild the feeder in OpenDSS (Open Distribution System Simulator, the open engine from the Electric Power Research Institute): bank, wires, loads and generators.

Step 03

Run the battery's hours

Charging is tested against the highest night load. Discharging is tested against the lowest daytime load. Those two hours push the grid hardest.

Step 04

Check protection and the state screens

Reverse power, ground overvoltage, islanding, voltage and thermal limits, and New York's Standardized Interconnection Requirements (SIR) screens.

Step 05

Size the largest fit

We step the battery up until the first limit fails. The size just below is the largest fit, and the failing limit names the fix. Sample run: 0.70 MW, set by the bank while charging at night.
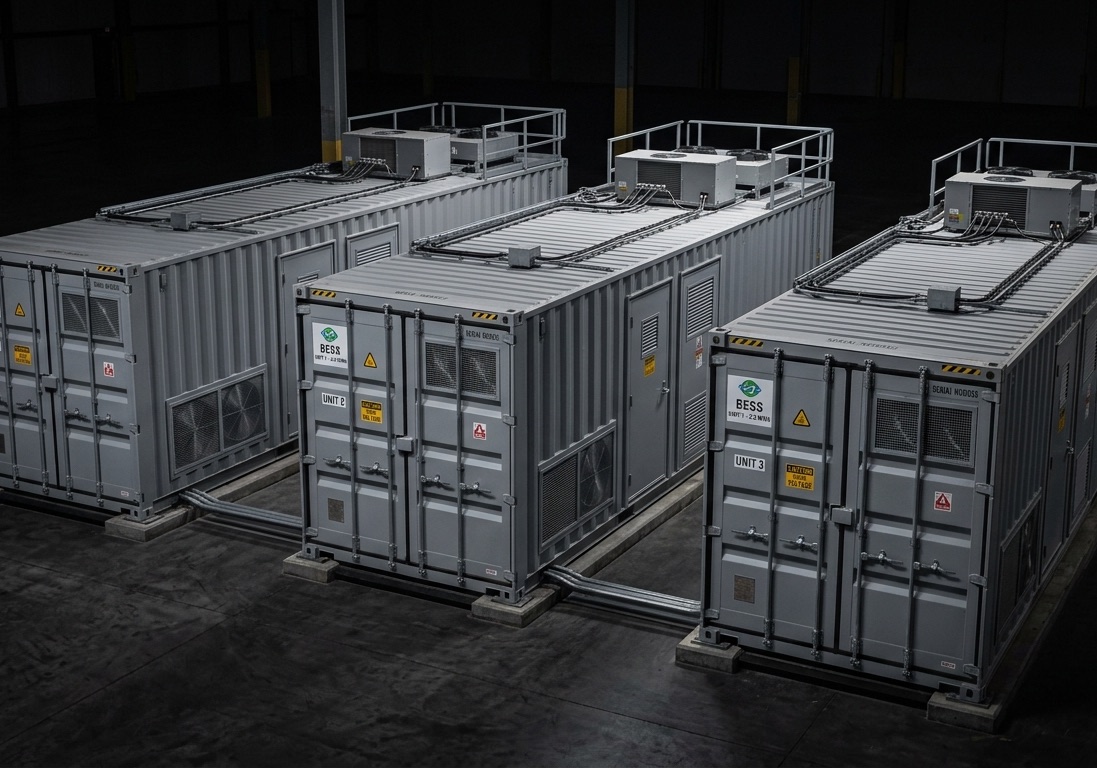
Sample run: Gaiergy Grid Studio, generic 4.8 kV site, daily cycle (physical limit 0.70 MW, first failure at 0.75 MW).
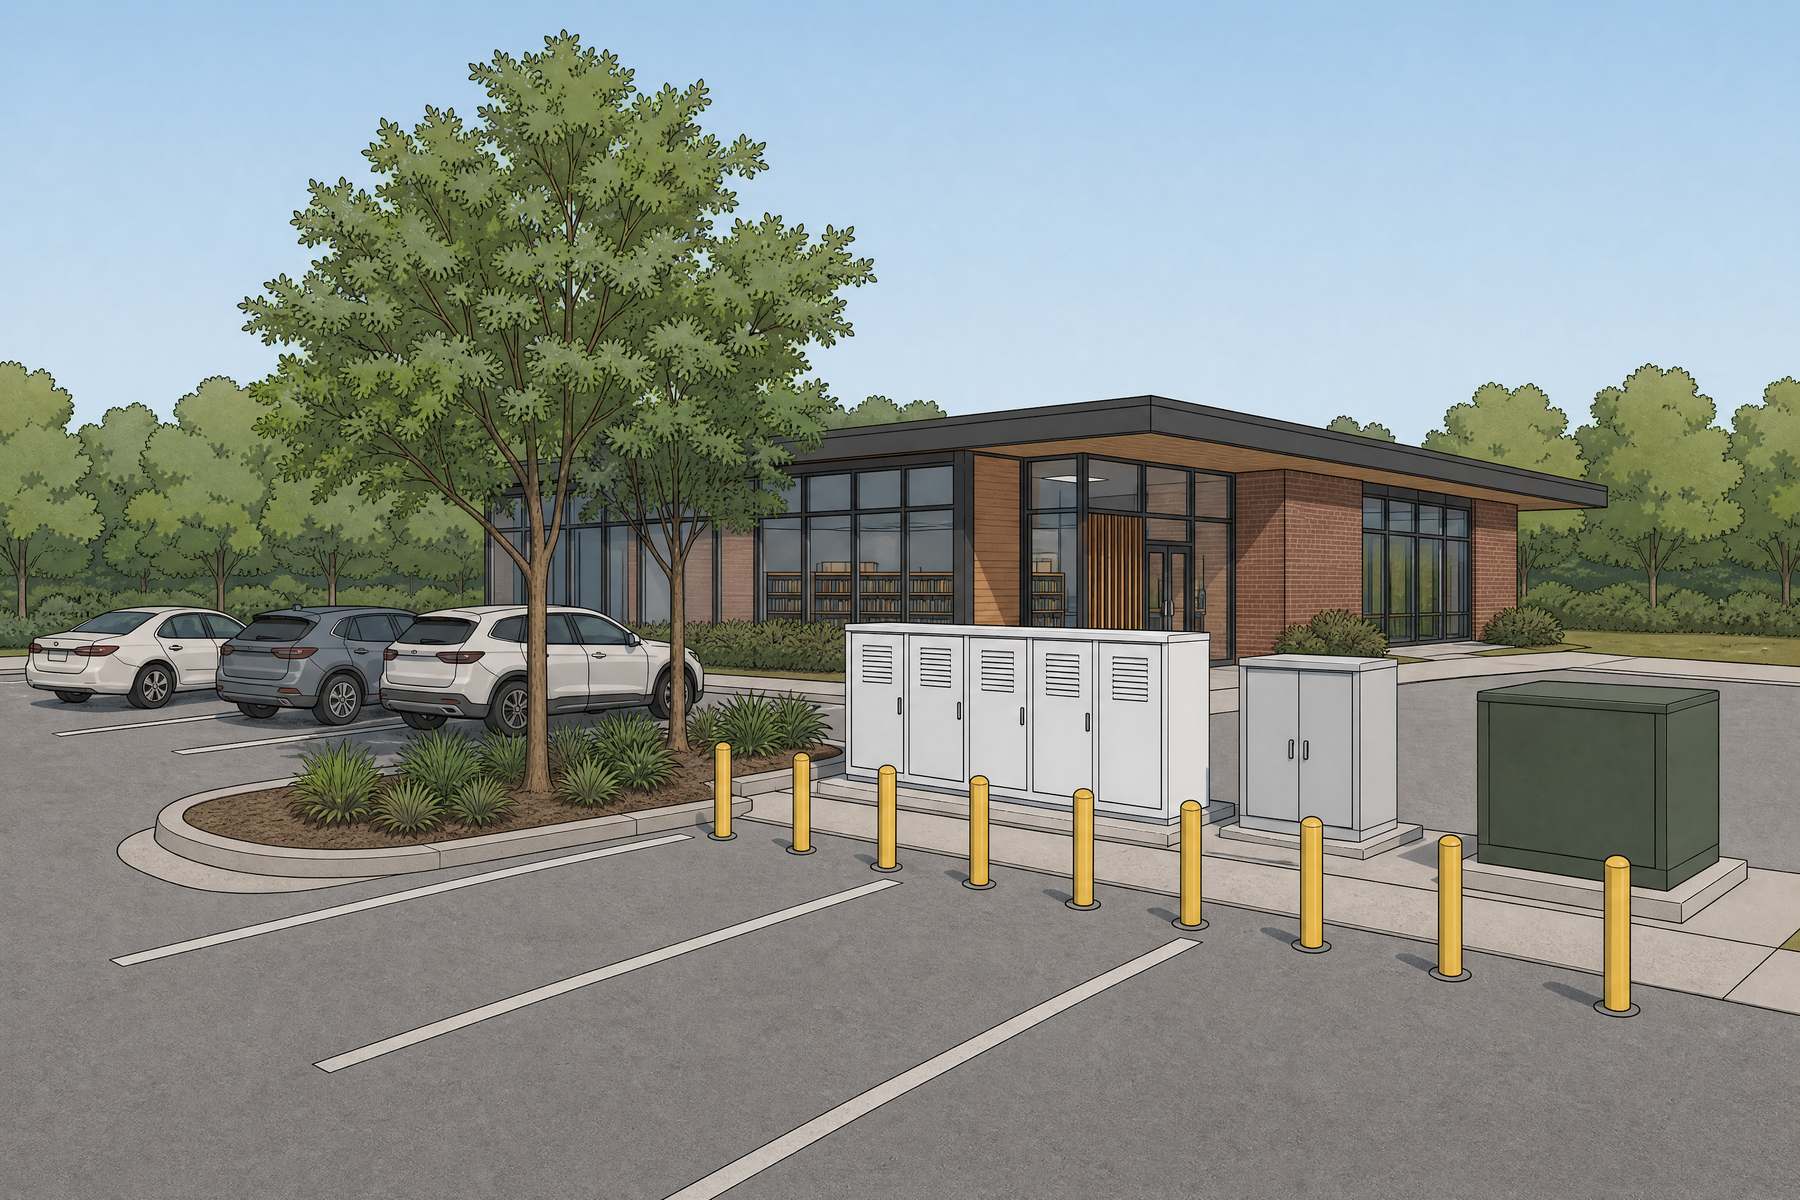
Illustration of battery cabinets beside a parking lot with a plain green transformer cube and bollards
What sits at the site. Battery cabinets, an inverter and a step-up transformer behind the meter. The grid study decides what the utility adds on its side. Illustration from Gaiergy's public energy contracts report, 2026; not a real site.
The engineering one-line

One drawing shows where the battery meets the grid.

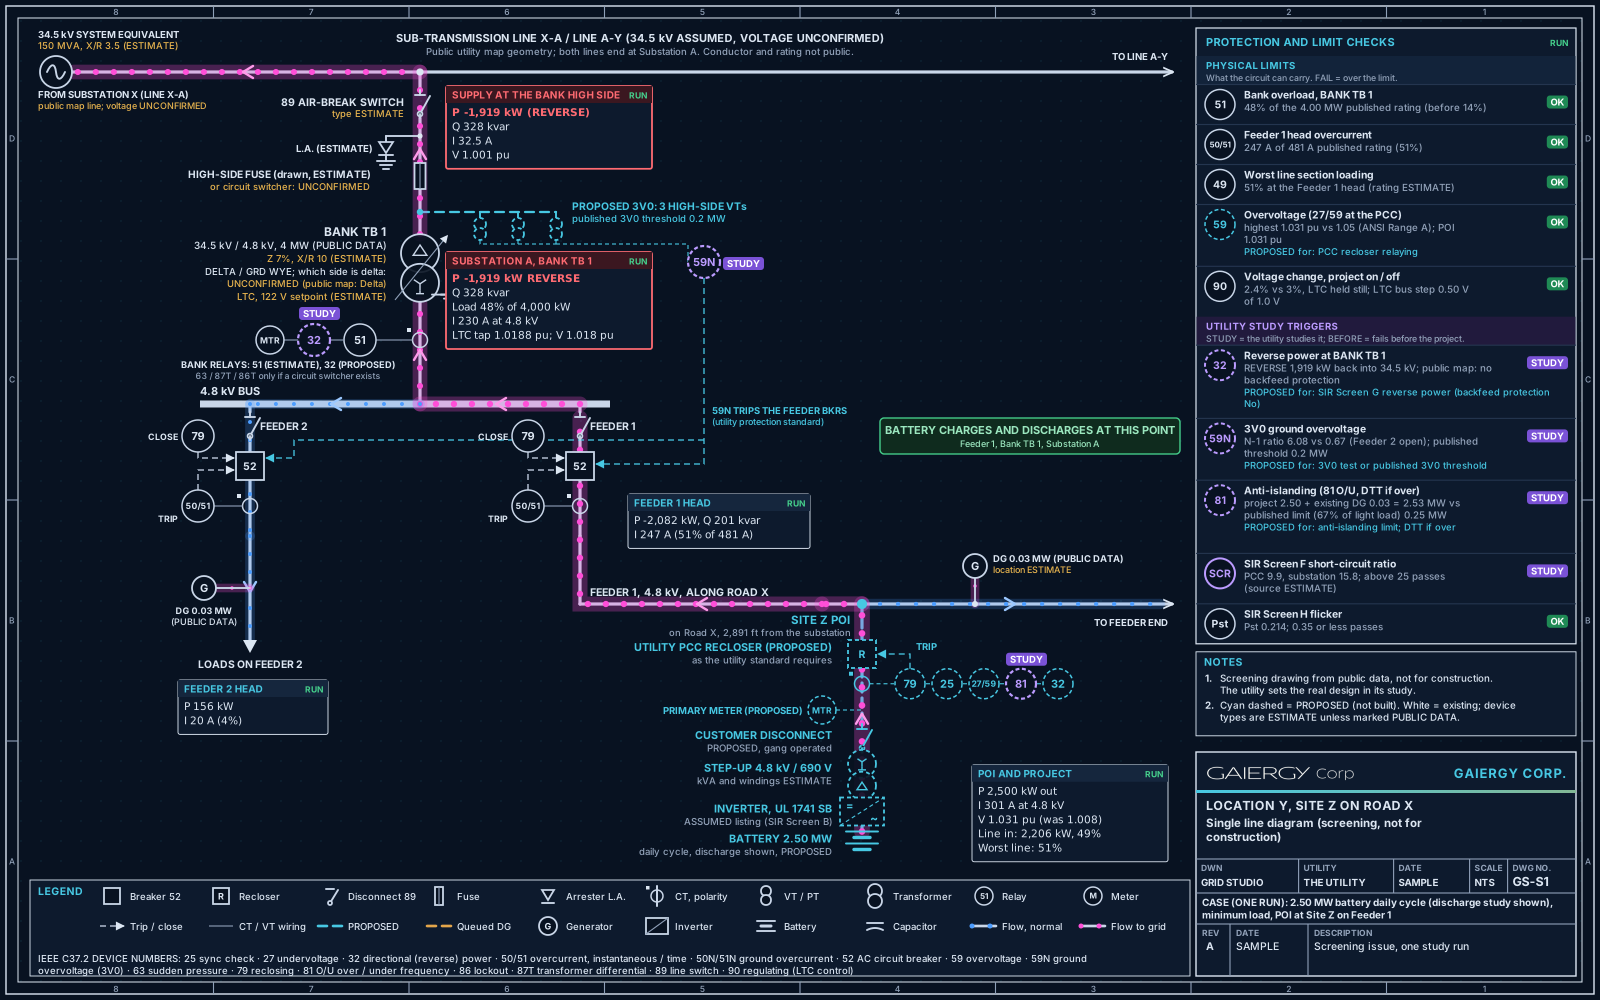
How to read it. Power comes in at the top and flows down through the substation bank to the feeders. Moving dots show the flow: blue is normal, magenta runs back toward the grid, and bigger, faster dots carry more power. Circles are protective relays, numbered by the IEEE C37.2 standard (Institute of Electrical and Electronics Engineers). Dashed cyan parts are proposed.
Open full size
Engineering single line diagram of a generic battery site with power flow
Generic site: Substation A, Bank TB 1, Feeder 1 along Road X, Site Z. Drawn by Gaiergy Grid Studio from one 2.50 MW daily-cycle run (discharge shown, light load). Screening drawing, not for construction.
What a battery can run into

Six problems the utility looks for.

Scroll the cards. Each one lights up its device on the drawing.

32

Reverse power at the bank

When the battery sends out more than the feeders use, power flows backward through the substation bank toward the higher-voltage line. In the sample run, 1,919 kW flows back.

SIR Appendix G, Screen G, p. 3. Sample run: Gaiergy Grid Studio.
3V0 / 59N

Ground overvoltage on the delta high side

Many substation banks are wired delta on the high side, so a ground fault on that line is hard to see from below. A battery that keeps feeding it can push the healthy wires far above normal voltage.

U.S. Department of Energy (DOE) Final Technical Report DE-SC0018888, 2021; SIR Section II.G, p. 29.
81 / DTT

Anti-islanding

If the utility opens the feeder, the battery must stop and not keep a piece of the grid alive by itself. Where generation is high against minimum load, the utility can add direct transfer trip (DTT), a signal that trips the battery.

SIR Section II.G, Islanding, p. 29.
27/59

Voltage rise at the connection

Pushing power out raises voltage where the battery connects. A project fails the screen if it pushes voltage outside ANSI C84.1 Range A. In the sample run the connection point rose from 1.008 to 1.031 per unit.

SIR Appendix G, Screen H item 2, p. 4. Sample run: Gaiergy Grid Studio.
51 / 49

Thermal loading of the bank and line

Charging at night adds to the night load on the bank and the wires. In the sample run, charging 2.50 MW at the highest night hour would load the bank to 148% of its rating.

Sample run: Gaiergy Grid Studio, generic site, highest night forecast hour.
Screen F / H

Short-circuit ratio and flicker

A weak point on the grid swings more when a battery ramps. The screens want short-circuit capacity more than 25 times the battery rating, and flicker (Pst) of 0.35 or less. The sample site scored 9.9.

SIR Appendix G, Screens F and H, p. 3. Sample run: Gaiergy Grid Studio.
How to overcome them

Six fixes, matched to the problems.

Green on the drawing marks where each fix goes.

59N

3V0 protection package

Three voltage transformers on the bank's high side feed a 59N relay. On a ground fault it trips the feeder breakers, which takes the battery off.

Joint Utilities of New York, Upgrade Cost Matrix, May 2026, row 20 (scope); DOE report DE-SC0018888, 2021.
32

Reverse-power relay and export limit

A reverse-power relay, or a battery controller that caps export, keeps flow at the bank going forward. The SIR requires function 32 when a battery's net export is limited.

SIR Section II, protective functions, p. 24.
79 · 25 · 27/59 · 81 · 32

Recloser at the point of connection

A utility recloser at the point of common coupling (PCC) carries reclosing, sync check, voltage, frequency and reverse-power relays, so the utility can isolate the site. The exact device is set in the utility's study (UNCONFIRMED until then).

SIR Section II, required protective functions, p. 24.
UL 1741 SB

Inverter settings

The SIR requires inverters listed to UL 1741 SB. Their settings can absorb reactive power to hold voltage down (power factor, volt-var, volt-watt). It is often the cheapest fix.

SIR p. 2; NYSERDA report 19-45, Mitigation Methods to Increase Feeder Hosting Capacity (EPRI, 2019), Section 2.
POI

Resize or move the connection

A smaller battery, or a point of interconnection (POI) on a higher-voltage line, can clear several limits at once. Grid Studio shows that the voltage of the line you connect to decides how big a battery fits.

Gaiergy Grid Studio, five New York connection points compared (gaiergy.com/tools/grid-studio).
51

Charging limits

Charge only when the bank has room, or cap the charge rate. In the sample run the night charge limit was 0.70 MW, while daytime discharge could reach 3.30 MW.

Sample run: Gaiergy Grid Studio, generic site, daily cycle.
What it costs and how long it takes

The study fee is small. The fix can be large, and slow.

Public New York figures for the most common substation fix, 3V0 protection on one bank, and for the study that prices it.

3V0 protection, one substation bank

Utility planning estimateESTIMATE
$567,231
Carried as an (E)stimate for one-bank jobs in an upstate New York utility's DG Interconnection Semi-Annual Cost-Sharing 2.0 Report, Oct 1, 2025 to Mar 31, 2026, NY Public Service Commission (PSC) Case 20-E-0543. dps.ny.gov
Statewide cost matrix, one bankESTIMATE
$476,000
Joint Utilities of New York, Technical Guidance Cost Matrix for Integrating DER, May 2026, row 20, one utility's entry. Scope includes load tap changer (LTC) replacement; excludes contingency and tax. dps.ny.gov
19 finished one-bank jobsACTUAL
$261,218median $593,627$1,130,546
Costs marked (A)ctual for one-bank 3V0 jobs in the same Cost-Sharing 2.0 Report, Oct 1, 2025 to Mar 31, 2026, PSC Case 20-E-0543. Two-bank jobs left out.
CESIR study feeESTIMATE
probably more than $12,000 on the low end; no published ceiling
CESIR: Coordinated Electric System Interconnection Review, the utility's study. One utility's filing shows one flat figure for every size band, which reads as a floor, not an average (Joint Utilities, CESIR Cost Drivers, 2022, p. 5). dps.ny.gov PDF

From application to a working fix

The utility's clocks in the SIR, in Business Days (BD). About 21.5 Business Days make a month.

Fastest path115 BD, about 5 months
10
15
10
20
60 CESIR
Slowest path185 BD, about 9 months
10
15
10
30 supp.
20
60 CESIR
+40
  • Completeness review, 10 BD (p. 6)
  • Preliminary screening, 15 BD (p. 7)
  • Applicant notice, 10 BD (p. 7)
  • Supplemental screening, 20 BD plus 10 BD notice (pp. 8 to 9)
  • CESIR invoice 10 BD and payment 10 BD (p. 8)
  • CESIR study, 60 BD (p. 11)
  • Up to 40 more BD by agreement (p. 11)
Source: New York State Standardized Interconnection Requirements (SIR), effective February 9, 2026, Case 24-E-0621, Section I.C, pp. 6 to 11, as cited on Gaiergy's public CESIR explainer. dps.ny.gov PDF · CESIR explainer
After the report

The contract and payments

Above $10,000 of upgrades: 25 percent within 90 Business Days, then 75 percent within 120.

SIR Step 7 and Section I.D, pp. 11 to 14.
Utility construction

3V0 build: 12 to 16 months

When the utility starts building is UNCONFIRMED; ask for the date in writing.

DOE Final Technical Report DE-SC0018888, 2021: about $500,000 and a 12 to 16 month construction timeline (ESTIMATE). osti.gov

Send us a site. We will show you what the grid will ask for.

We start with the feeder model and finish with the fix, the cost and the timeline.

Email
contact@gaiergy.com
Phone
(646) 580-0701
Locations
New York City, NY / Jupiter, FL